
Quick Facts:
- Gold/yellow teams do best in MLS regular season (1.51 points per game)
- Green teams dominate in NWSL regular season (1.64 points per game)
- MLS teams perform similarly (small 0.21 points per game gap)
- NWSL shows slightly bigger differences between colors (0.56 points per game gap)
- Teams with blue have won the most titles
As we enter the final weekend of March Madness, we’re reminded of this 2018 article the NCAA published noting that from 1985 to 2018, blue teams were most successful and won 57.2% of tournament games. This made me curious if soccer teams with certain colors do better than others. So, we looked at data from the past 10 seasons (2015-2024) of MLS and NWSL to find out more.
What We Measured
Before jumping into the on-field performance, we first gathered the current primary colors of all teams from this website. Then calculated the points per game for each club over the past decade—and separately each team’s post-season appearances—and correlated performance to individual colors.
Also of note, White was left out of the review since it’s used by most, if not all, teams. And colors like Cyan and Lavender were merged with colors like Blue and Purple, respectively, to streamline things.
Regular Season Performance
After crunching the numbers for both leagues, some clear patterns emerged. MLS teams show remarkably similar points per game across colors with a 0.21 PPG separation between best-performing and worst-performing colors. The difference between highest and lowest colors in NWSL is more than double this, with a difference of 0.56 PPG.
Major League Soccer
What immediately stands out in MLS is how little difference team colors seem to make. Gold/Yellow teams lead with 1.51 PPG, followed by Green teams at 1.44 PPG. Pink shows strong performance at 1.42 PPG (though from only one team). Orange teams have the lowest average at 1.30 PPG. The performance gap between highest and lowest performing colors is 0.21 points.
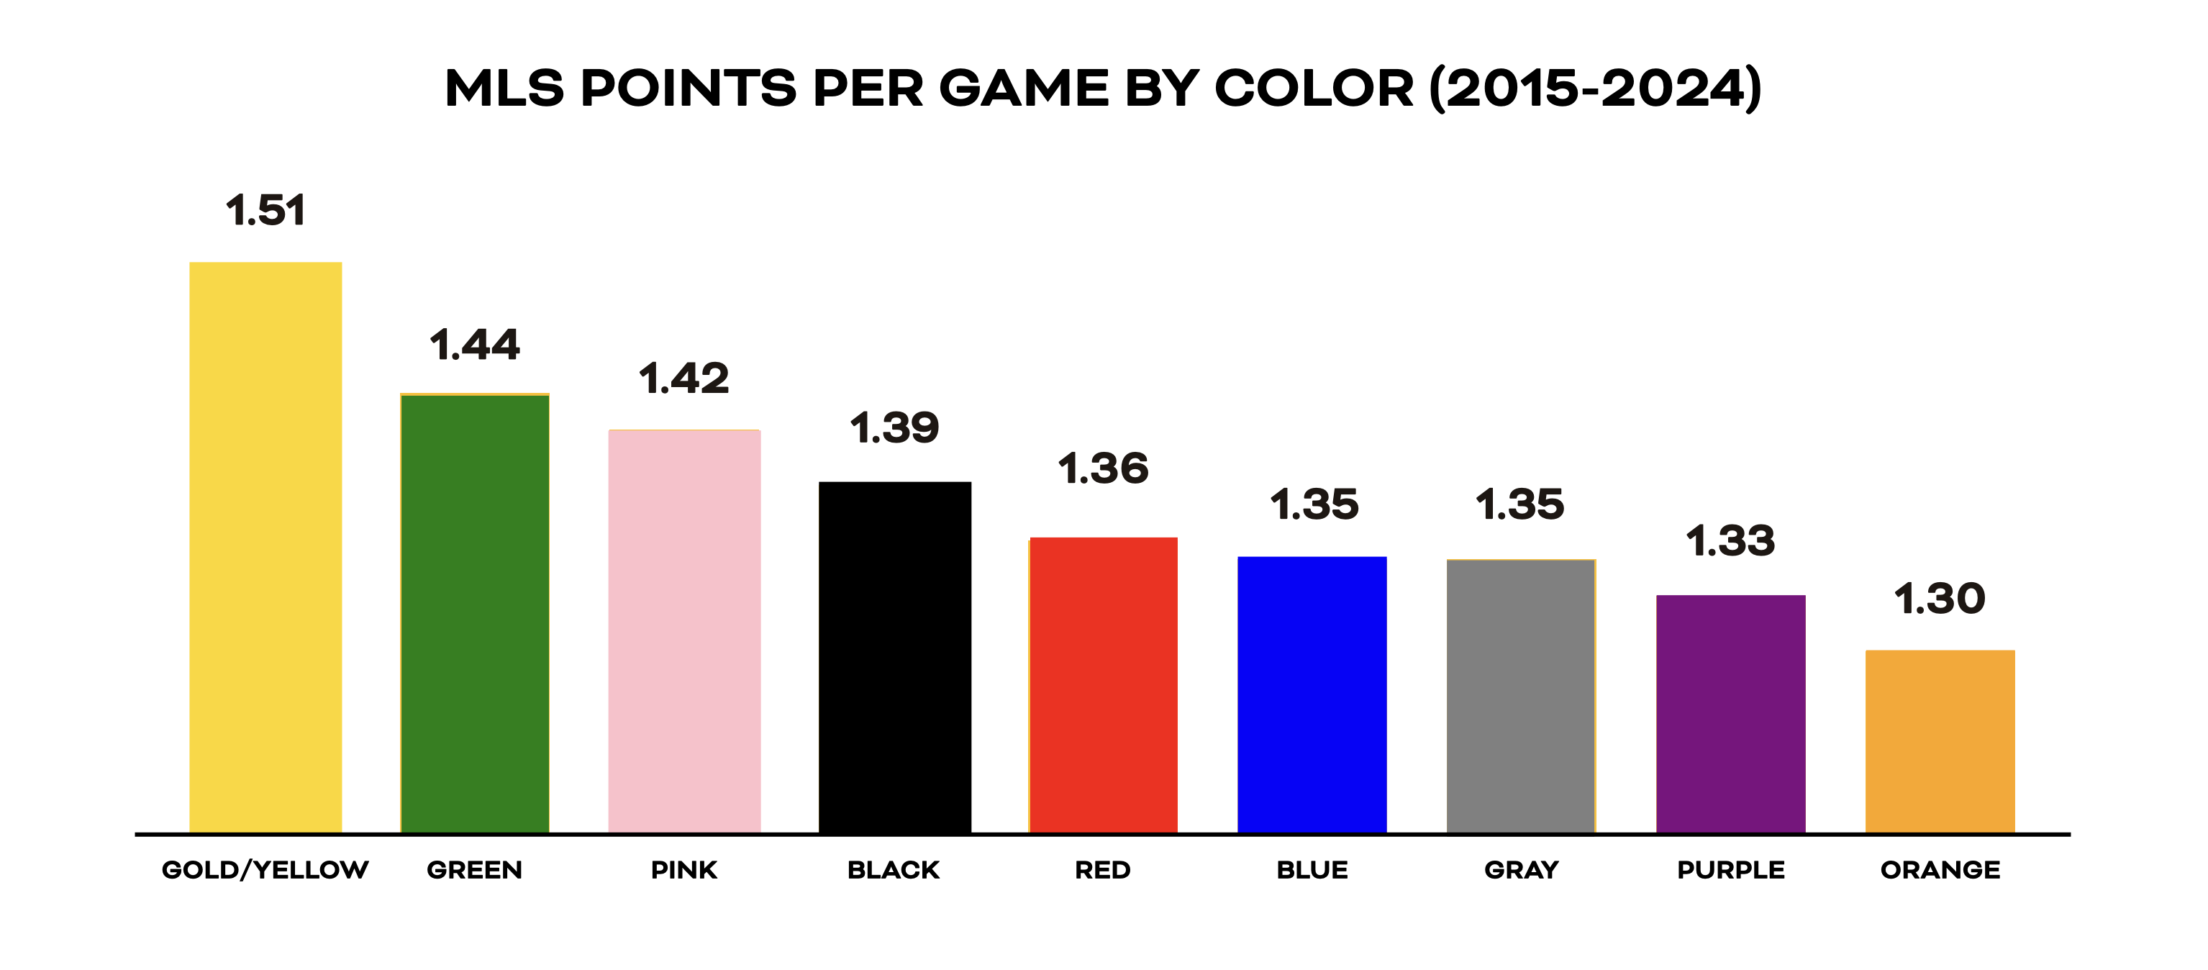
The narrow performance range in MLS likely reflects both league parity mechanisms (salary caps, allocation money, etc.) and statistical smoothing from having 30 teams. With multiple teams using each color, individual outlier performances have less impact on color-based statistics.
National Women’s Soccer League
The NWSL tells a slightly different story. The gap between the most successful color (Green at 1.64 PPG) and least successful (Purple at 1.08 PPG) is more than double that of the MLS difference at 0.56 PPG.
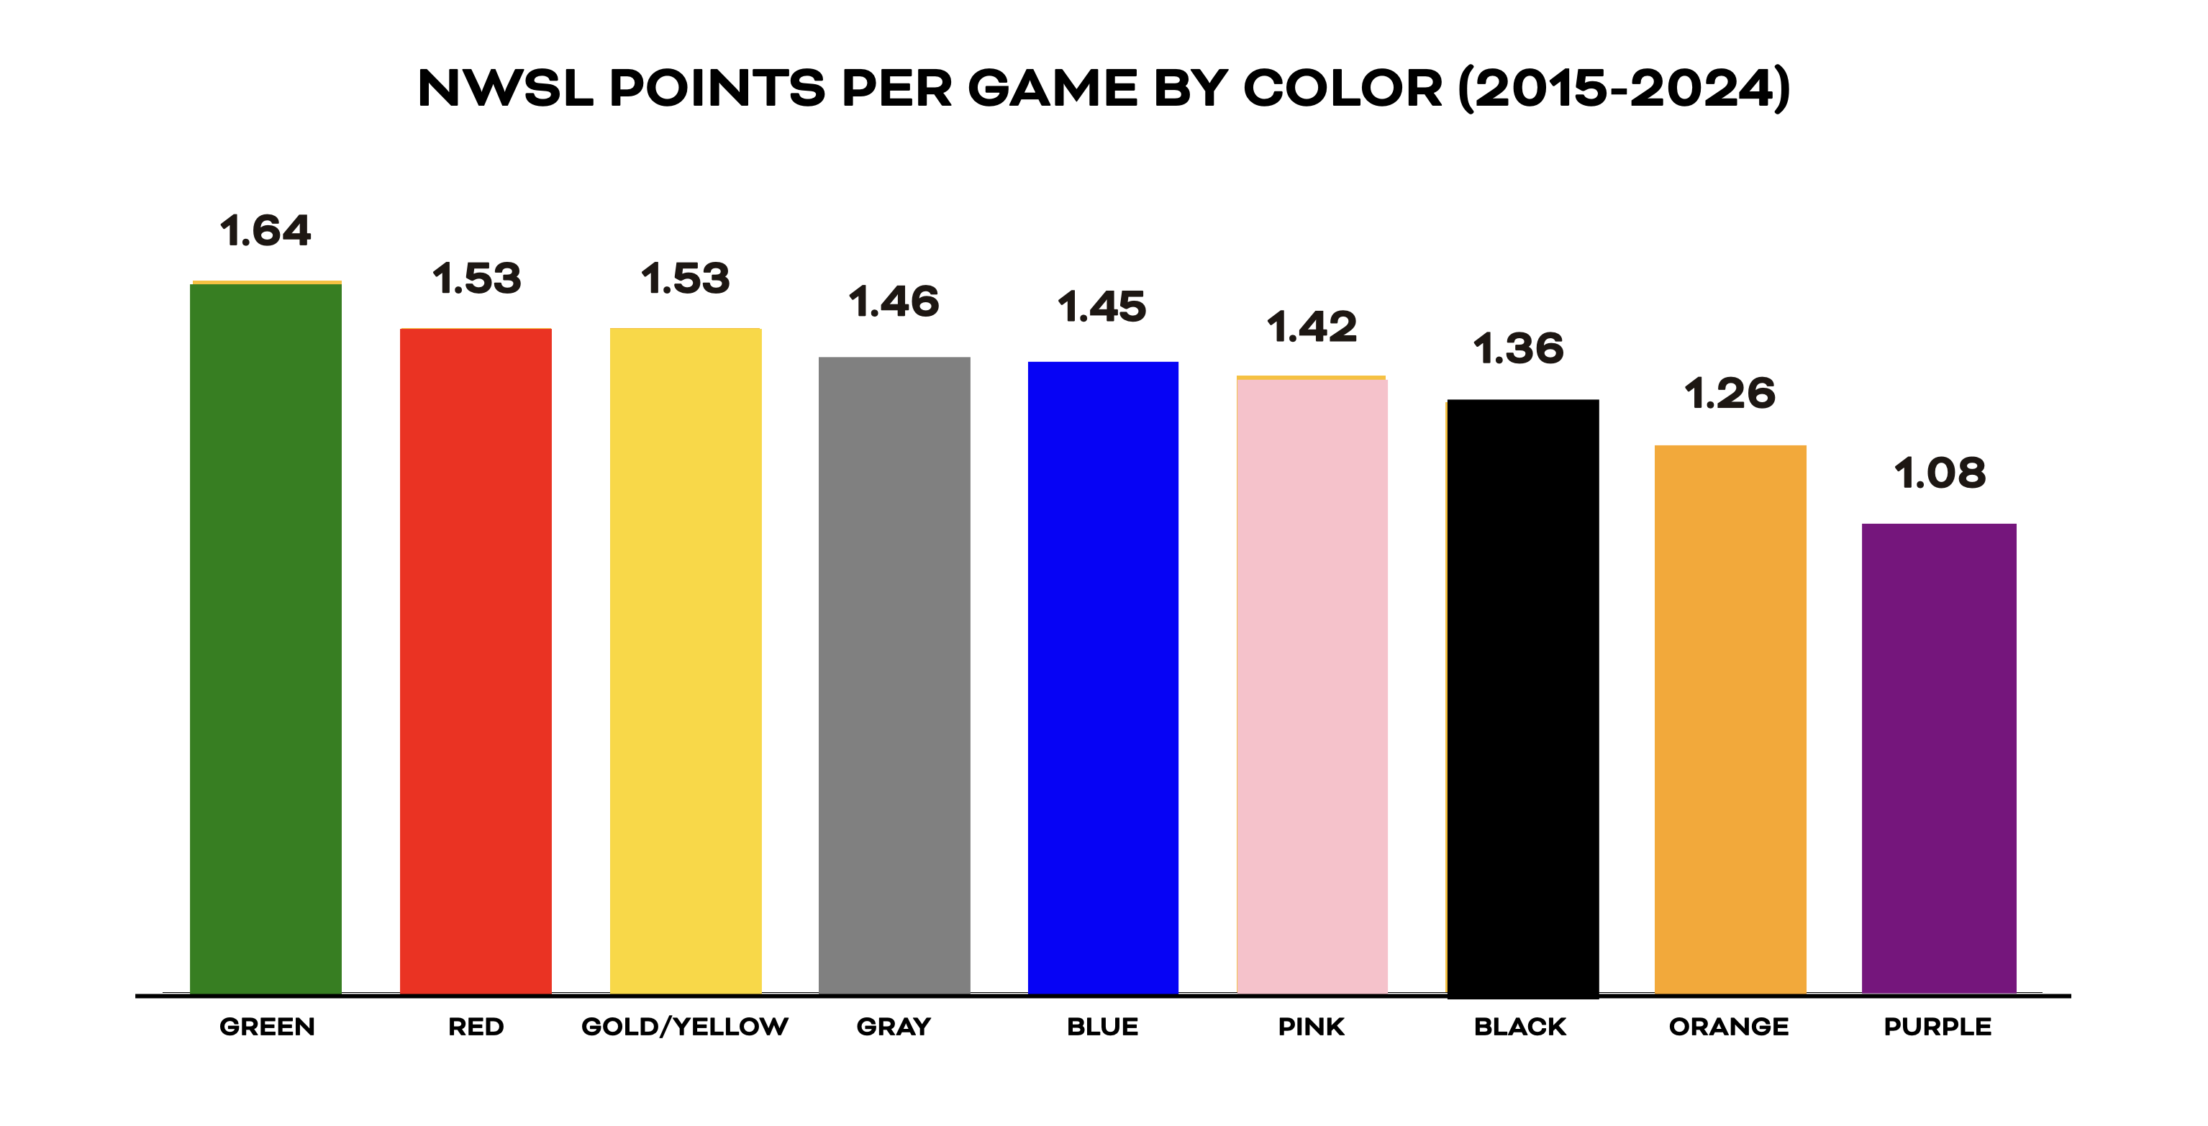
Green teams command an impressive 1.64 PPG. Red and Gold/Yellow tie for second at 1.53 PPG. At the bottom, Purple teams average just 1.08 PPG, creating a much wider performance gap of 0.56 points between top and bottom colors.
This variance comes with an important caveat: with only 14 teams in the NWSL, individual team performance has an outsized effect on color statistics. Since the Portland Thorns are the only team with green in their color scheme, their success single-handedly makes green the “most successful” color.
Postseason Appearances
While regular season performance gives us a good baseline, the playoffs are where legacies are made. Looking at postseason appearances by color reveals some interesting patterns:
MLS Playoff Qualification by Color
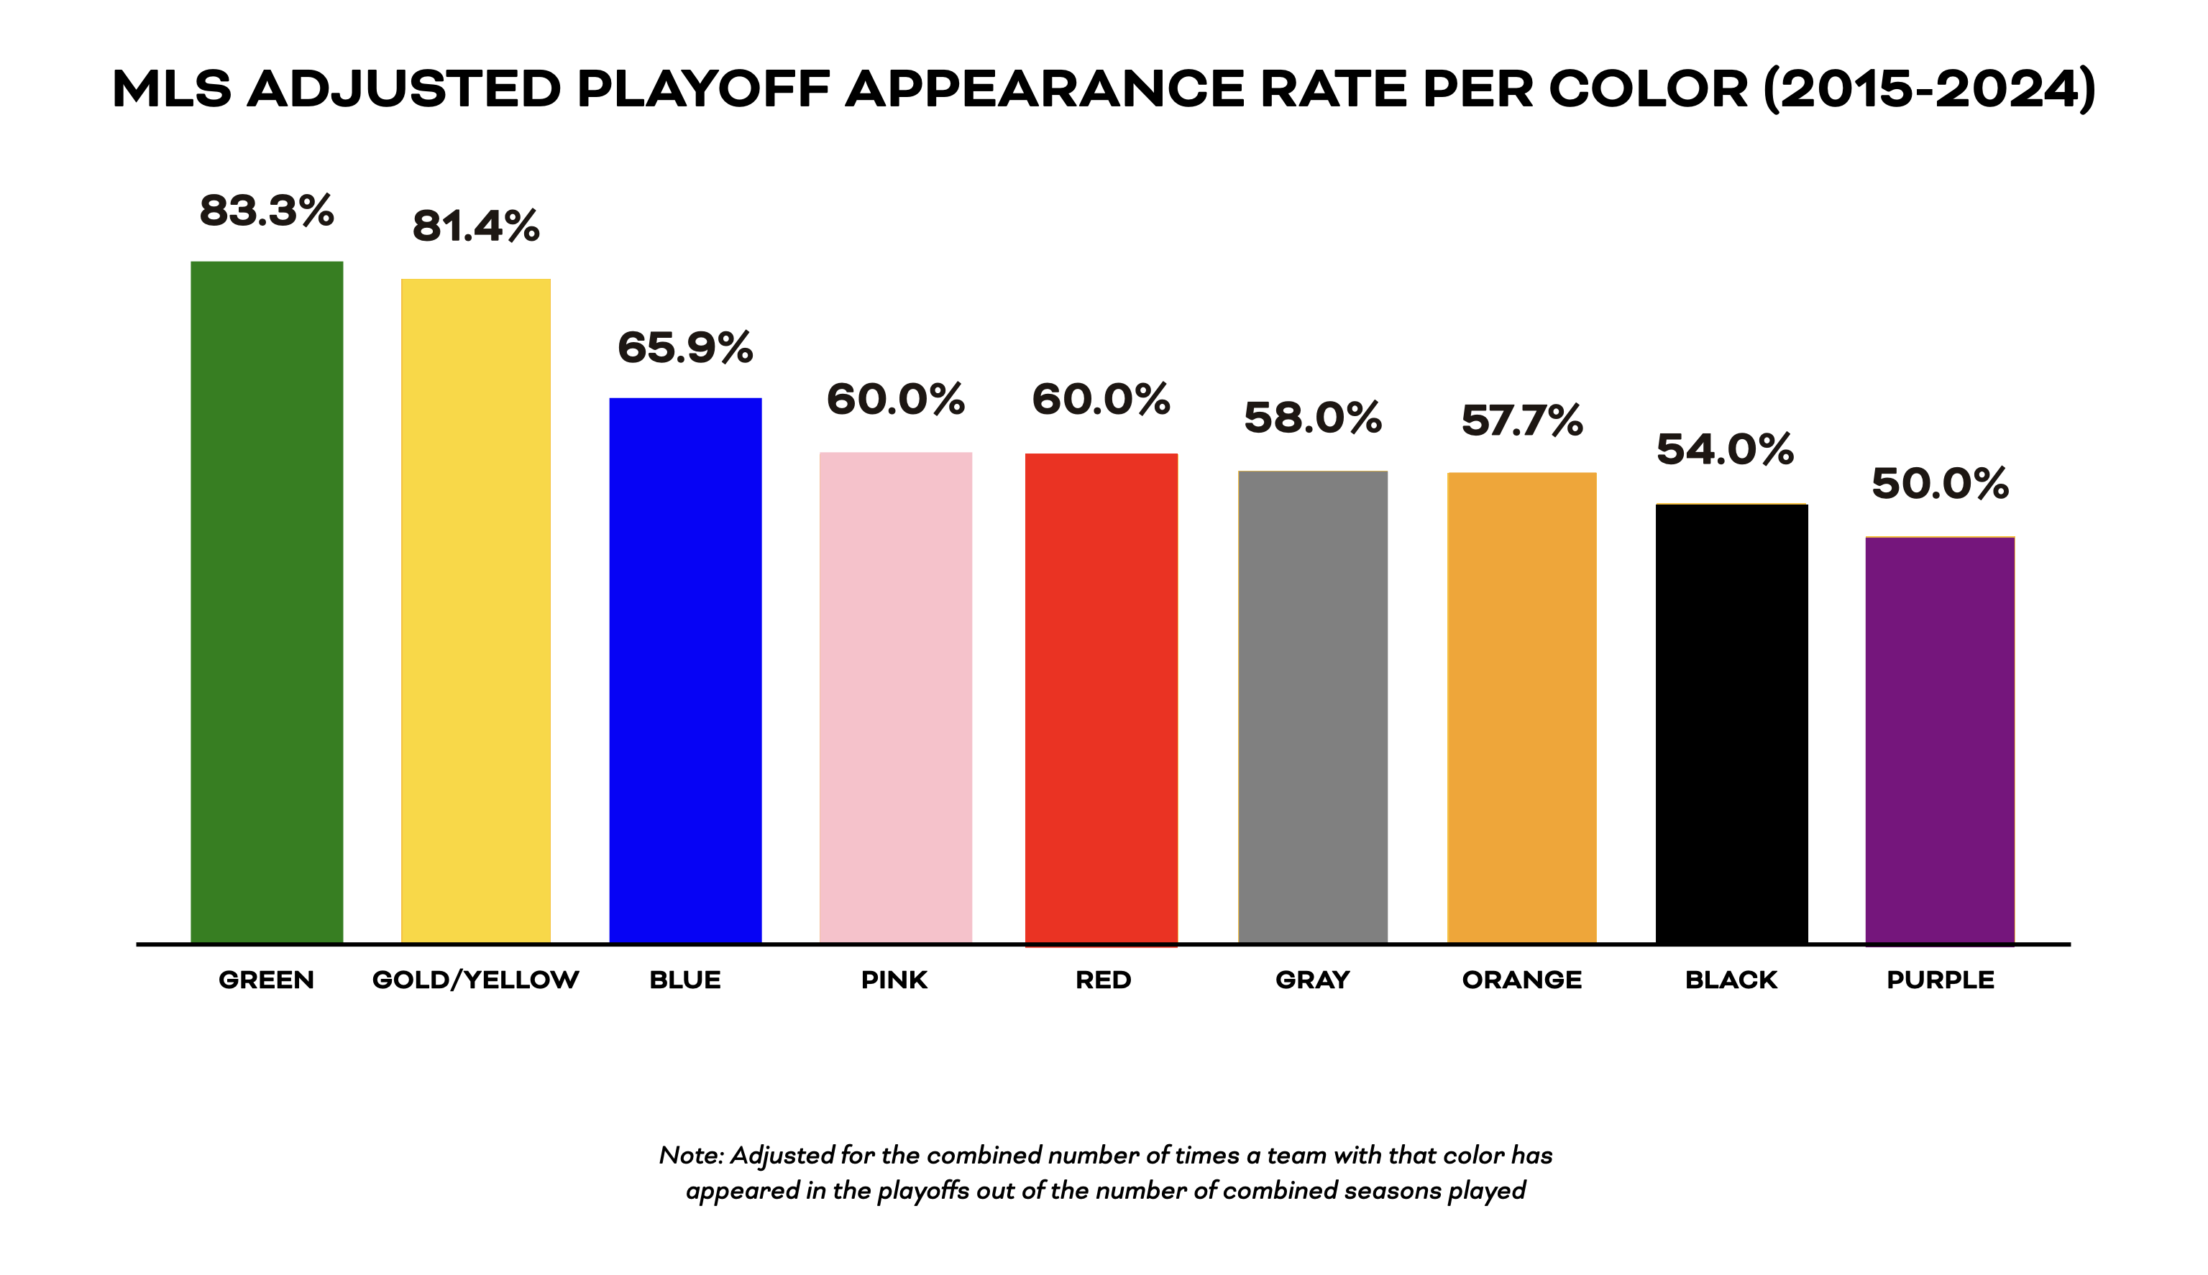
Green teams lead with an 83.3% playoff qualification rate, followed by Gold/Yellow at 81.4%. Blue (65.9%), Pink / Red (60.0%), Gray (58.0%), Orange (54.0%), and Black (54.0%) form the middle tier, while Purple has the lowest rate at 50.0%. The spread between top and bottom is 33.3% percentage points.
NWSL Playoff Qualification by Color
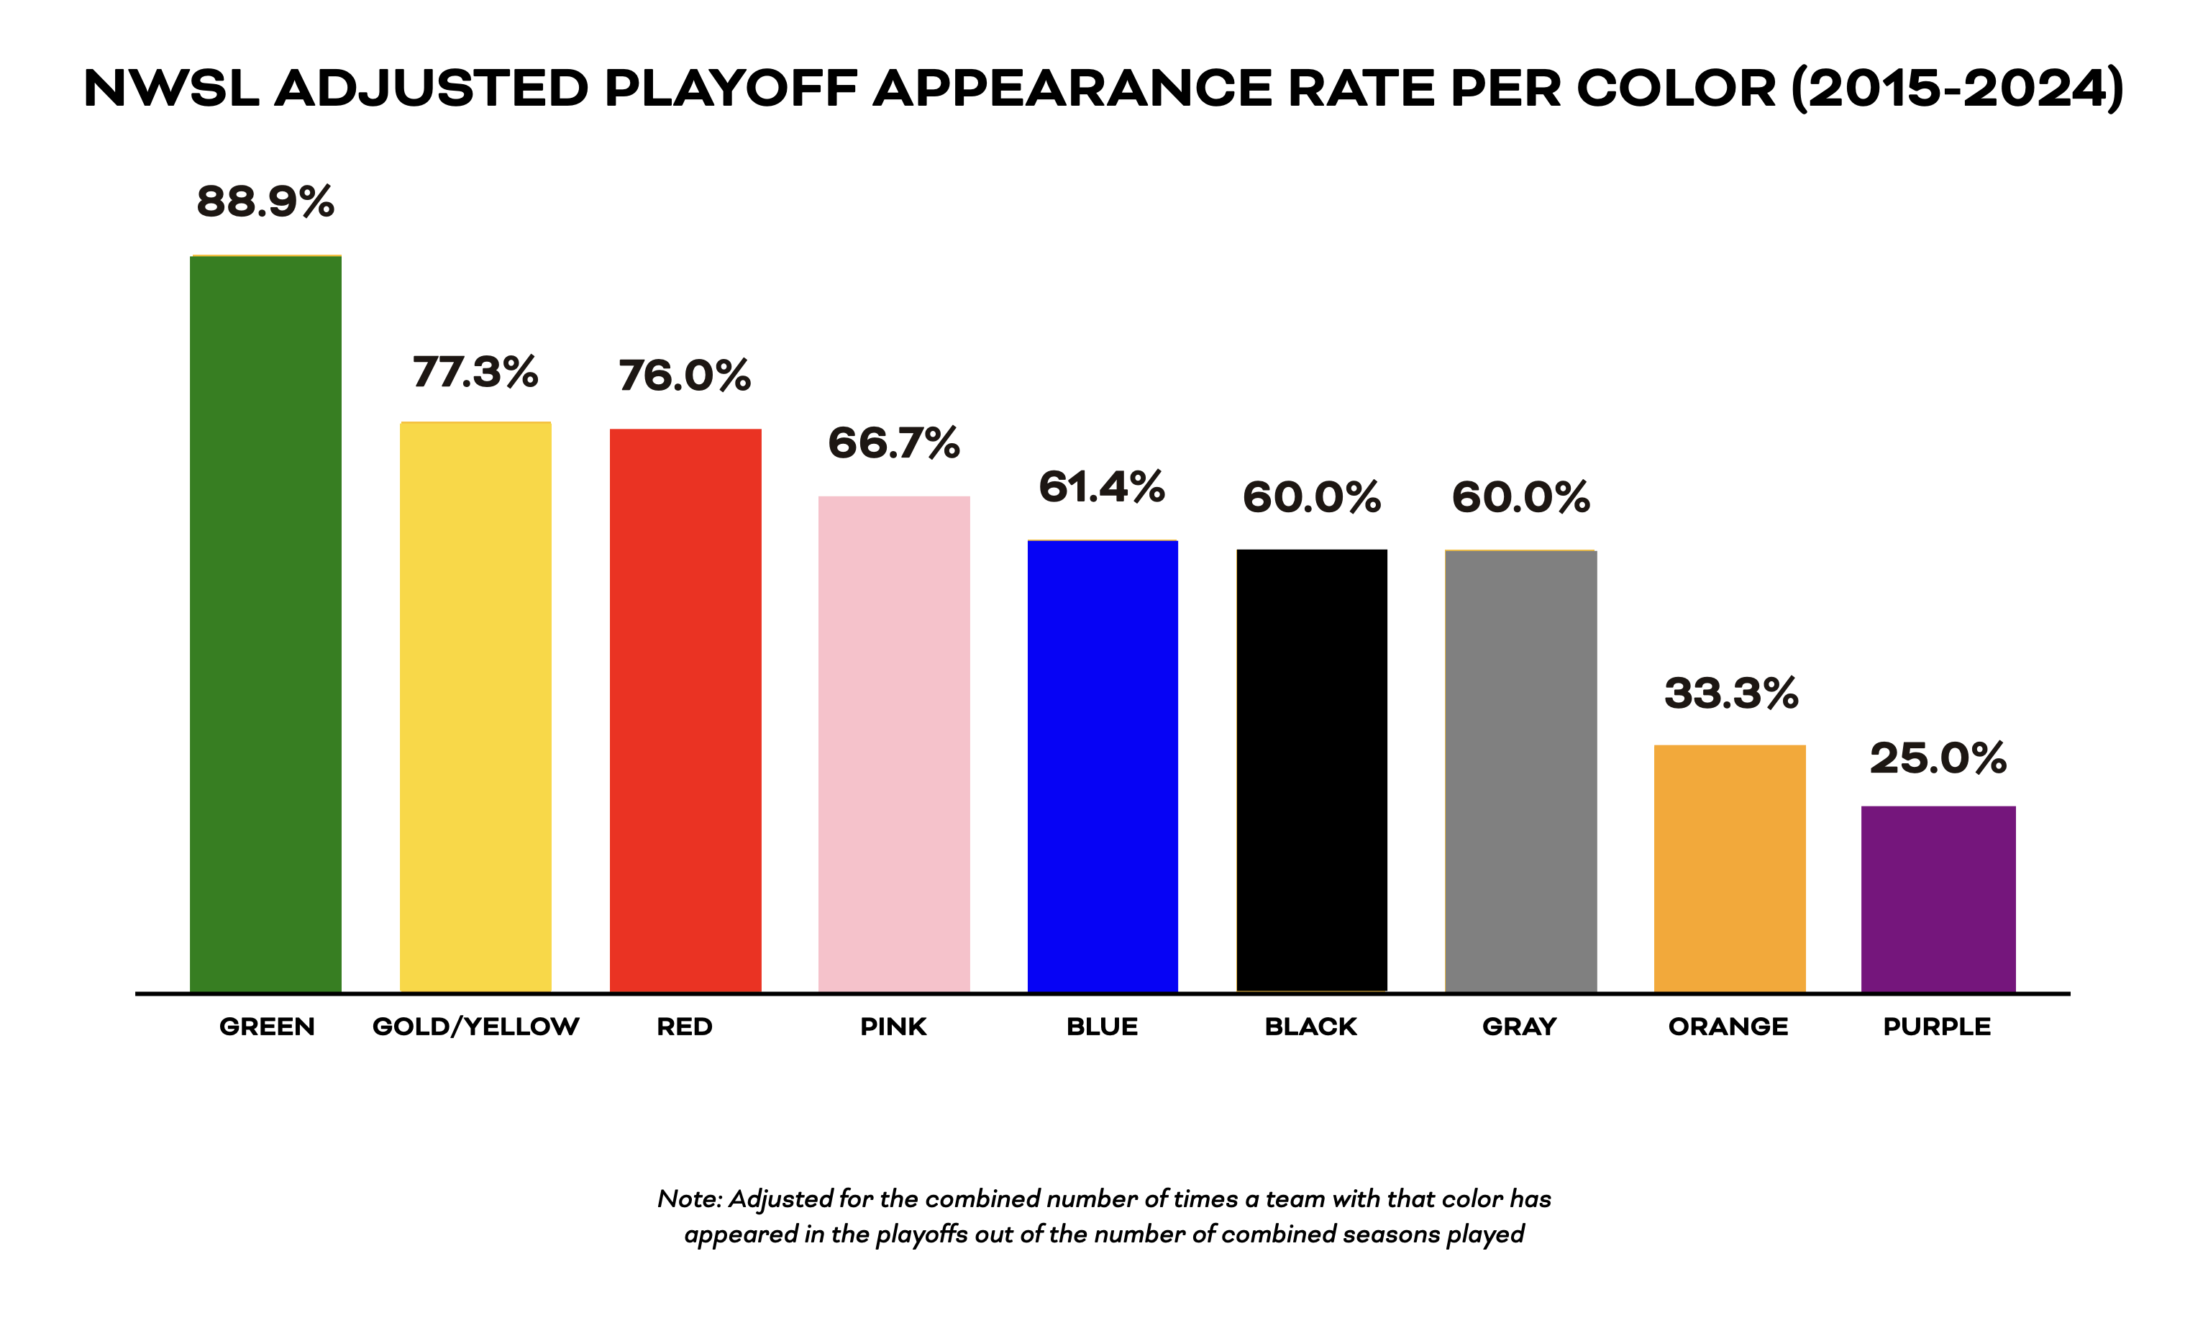
NWSL shows sharper contrasts, with Green achieving an 88.9% playoff appearance rate, followed by Gold/Yellow (77.3%) and Red (76.0%). Pink (66.7%), Blue (61.4%), and Black / Gray (60.0%) form the middle tier, while lowest performer Purple at just 18.8%. This creates a dramatic 63.9% point gap between best and worst colors.
Championship Colors
If championships are the ultimate measure of success, which colors have the hardware?
| Color | MLS Cup Titles | NWSL Championship Titles | Total Titles |
|---|---|---|---|
| Blue | 4 (Seattle Sounders FC, New York City FC, LA Galaxy) | 6 (Orlando Pride, NJ/NY Gotham FC, Washington Spirit, North Carolina Courage, FC Kansas City) | 10 |
| Black | 5 (Columbus Crew, Los Angeles FC, Atlanta United FC, Portland Timbers) | 4 (NJ/NY Gotham FC, Portland Thorns FC, Western New York Flash) | 9 |
| Red | 3 (Atlanta United FC, Toronto FC, Portland Timbers) | 6 (Portland Thorns FC, Washington Spirit, North Carolina Courage, Western New York Flash) | 9 |
| Gold/Yellow | 5 (LA Galaxy, Columbus Crew, Los Angeles FC, Atlanta United FC) | 2 (North Carolina Courage) | 7 |
| Green | 3 (Seattle Sounders FC, Portland Timbers) | 2 (Portland Thorns FC) | 5 |
| Gray | 1 (Toronto FC) | 1 (Washington Spirit) | 2 |
| Orange | 1 (New York City FC) | 0 | 1 |
| Purple | 0 | 1 (Orlando Pride) | 1 |
Blue dominates with 10 total titles split evenly between leagues, while Black and Red tie for second with nine championships each. Red performs notably stronger in women’s soccer, claiming twice as many NWSL titles. Despite limited representation, Green teams have secured five championships through Portland’s organizations and Seattle Sounders.
Color Chemistry: What’s Really Happening?
The most reasonable conclusion? In reality, team colors have virtually no impact on actual performance. Unfortunately, there’s no mystical power among the colors themselves.
In a larger league like MLS, with multiple teams wearing each color, these effects largely cancel out and result in the narrow performance band we observed. With only 14 NWSL teams versus 30 MLS teams, individual team performance heavily skews NWSL color statistics
So, if you’re picking tournament brackets based on color, the data suggests:
- For NCAA basketball: Favor blue and orange teams
- For MLS success: Gold/Yellow and Blue are your best bets
- For NWSL success: Green is reliable, while Blue and Red share championship glory
Don’t bet your savings on a team just because they wear a certain color. Unless, of course, it’s March Madness and you’re picking between two blue teams. Then all bets are off!